Disease Locations and Monitoring
Please contact us if you would like a close-up map of a particular area or ArcGIS shapefiles of tanoak mortality and/or P. ramorum detections.
We do our best to update maps with the latest monitoring information when available.
CLICK on any map to enlarge or expand it
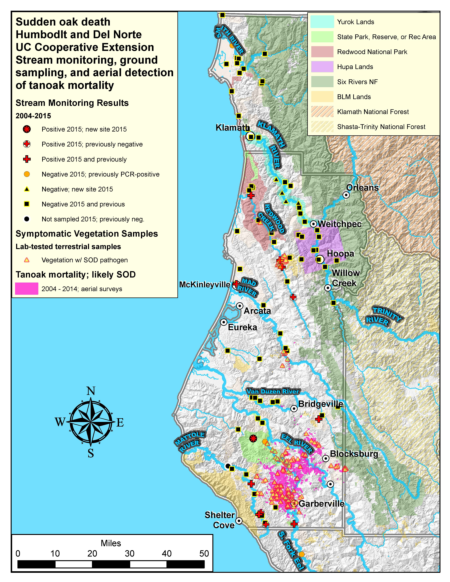
Map of confirmed SOD locations in Humboldt County
Ground surveys (looking for and sampling symptomatic vegetation) are often conducted where aerial surveys or stream baiting (see next map) suggest the pathogen is present. We also check locations where people report seeing symptoms on the ground, and in locations proximal to known infestations where access is possible and vegetation is susceptible.
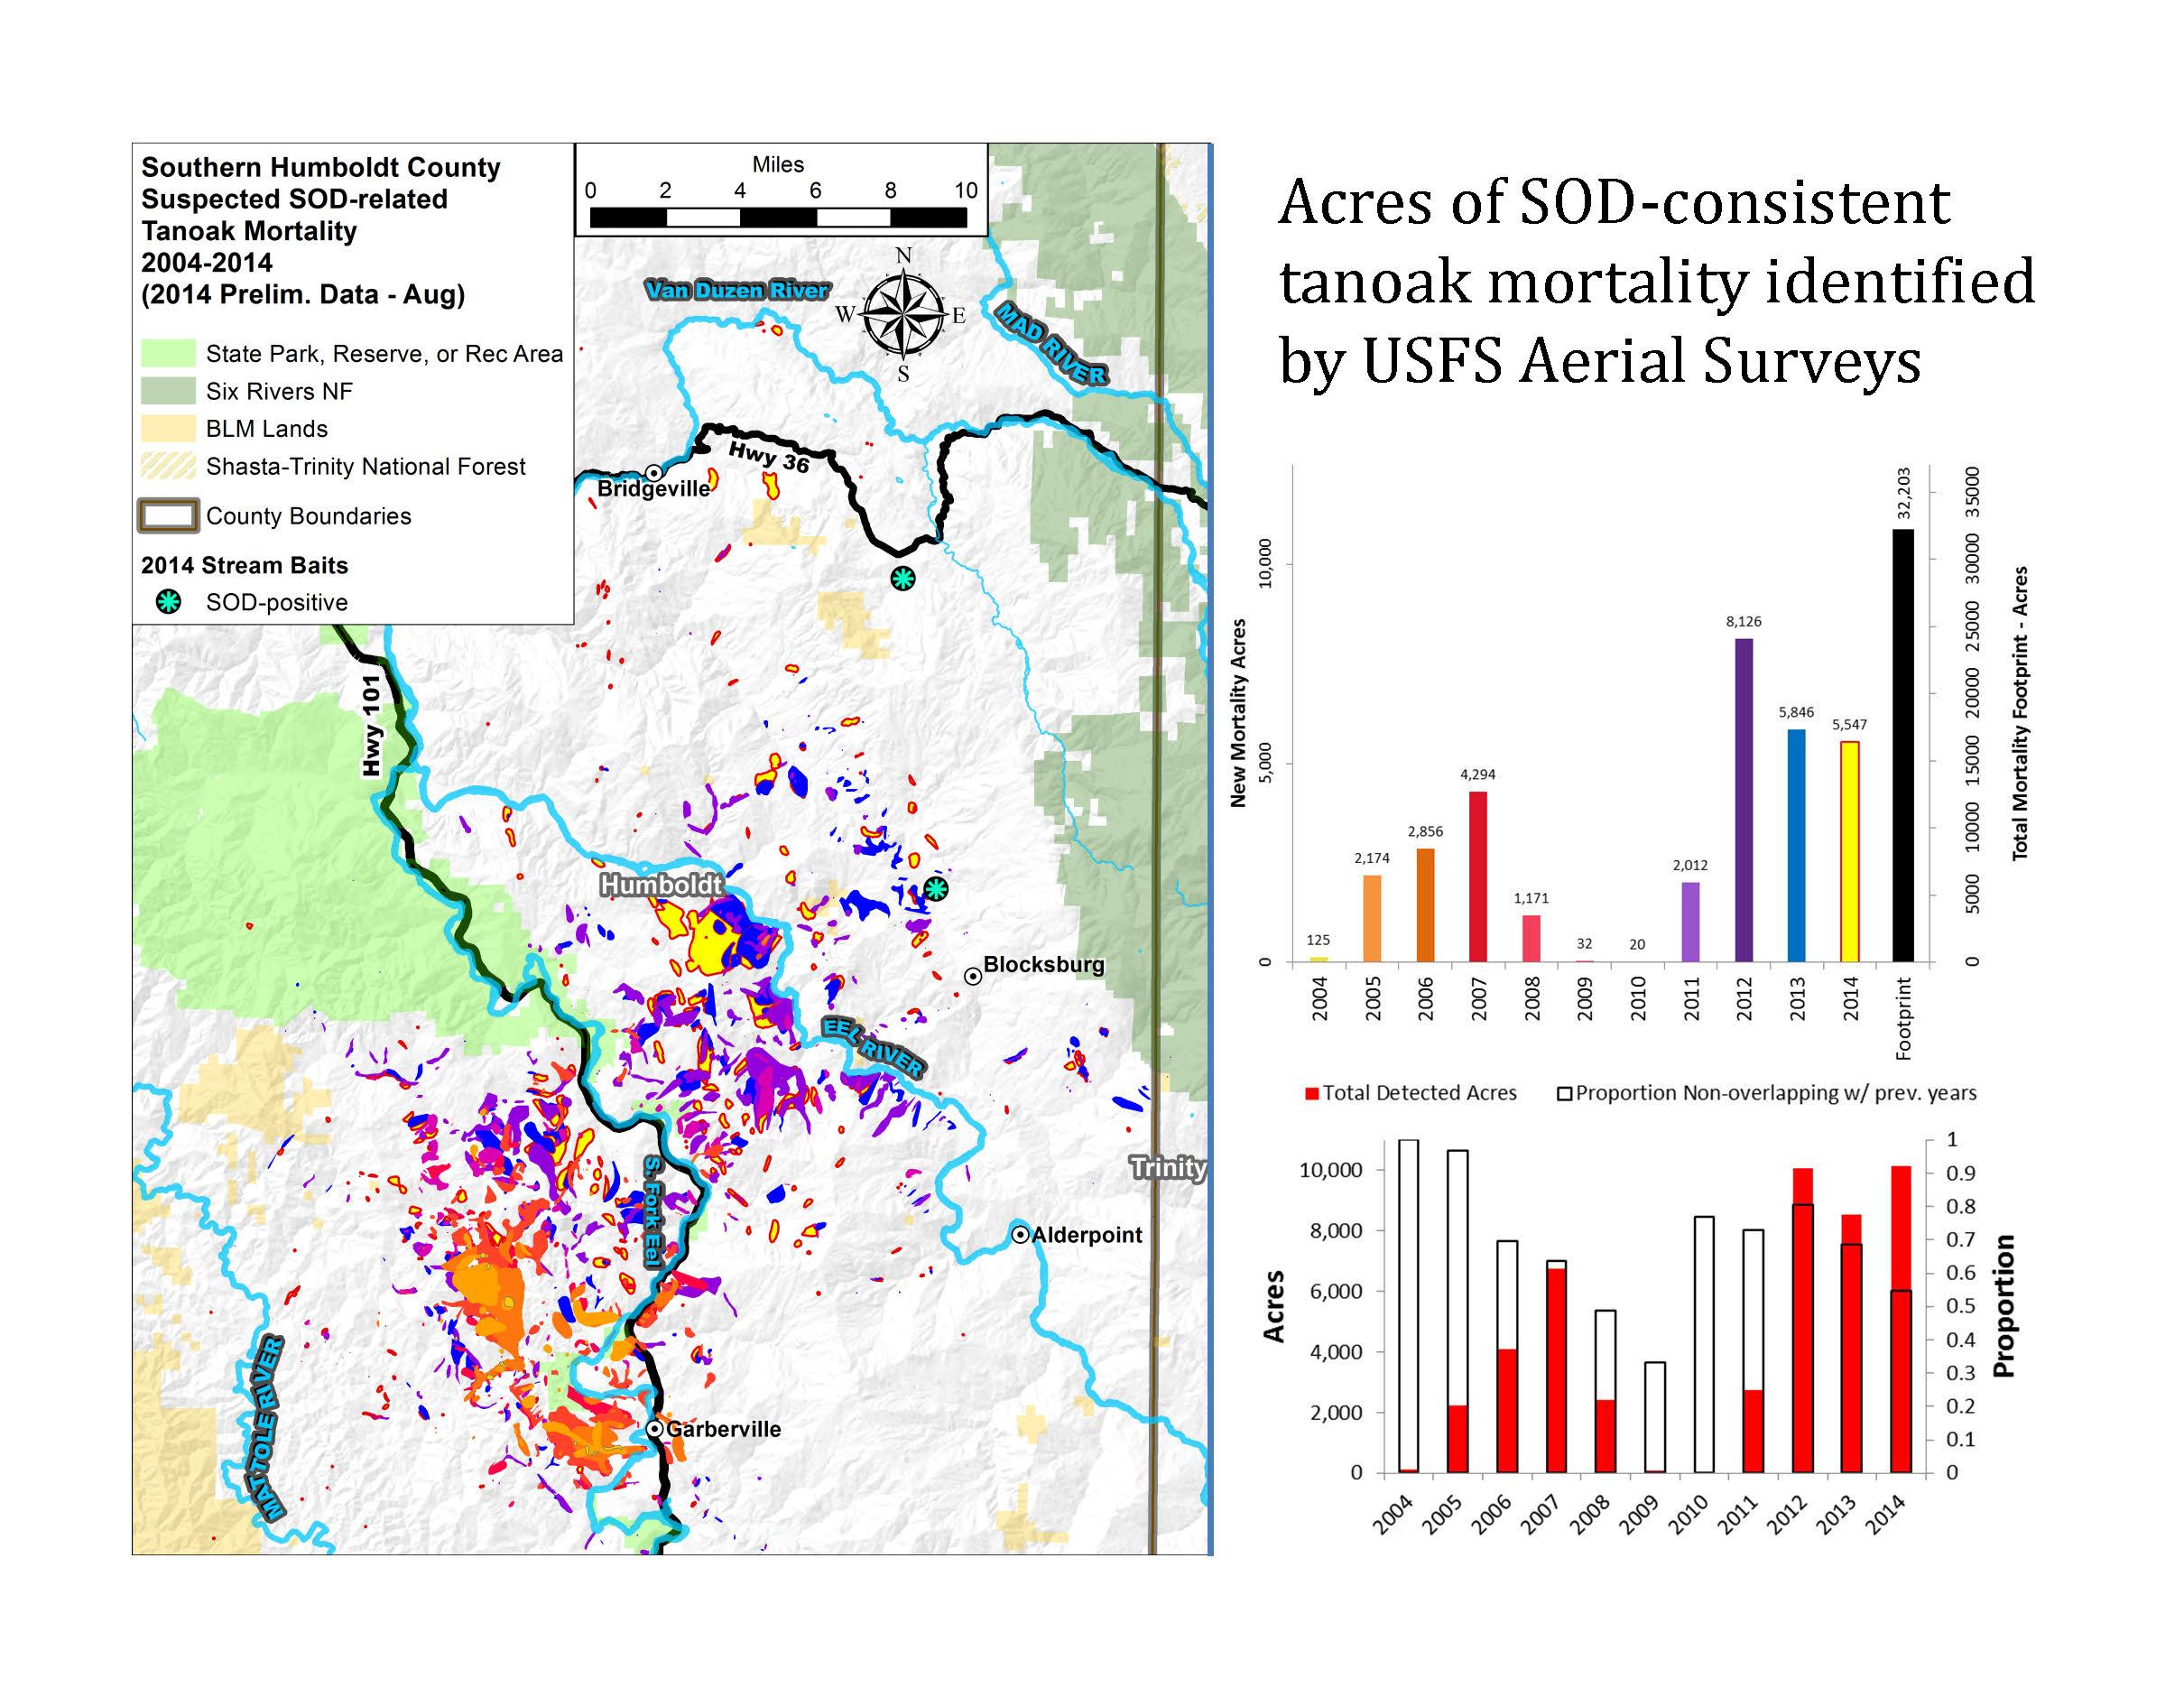
See also the "Chronology of SOD-related Tanoak Mortality in Humboldt" section below for extent of tree mortality caused by SOD.
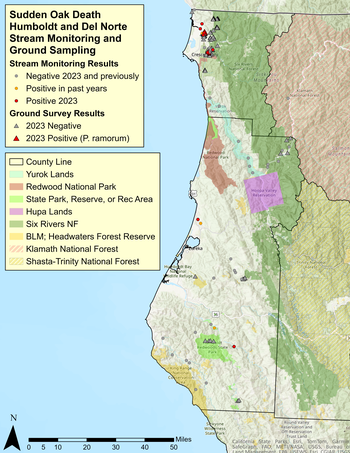 Disease confirmed by UC Davis Rizzo Lab and UCCE Humboldt in 2023

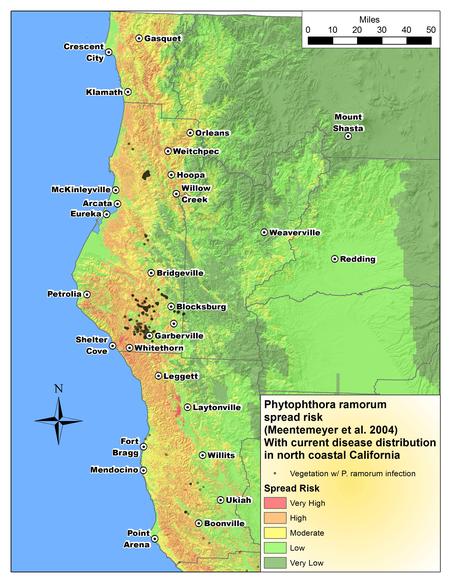
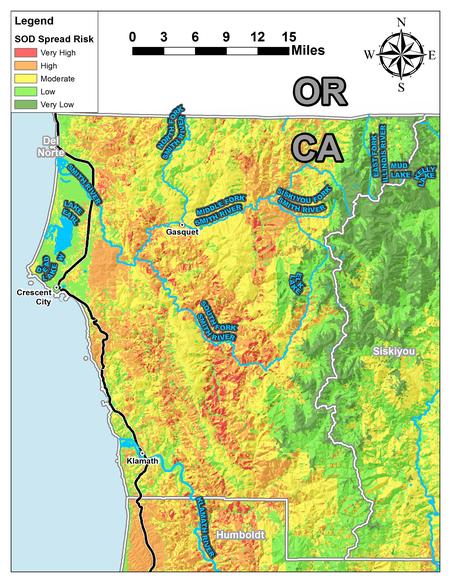
Spread risk maps with locations of SOD positives in streams and/or vegetation
Risk of SOD spread is based upon the distribution of climate and known hosts and their epidemiological attributes (see reference below).
Chronology of SOD-related tanoak mortality in Humboldt.
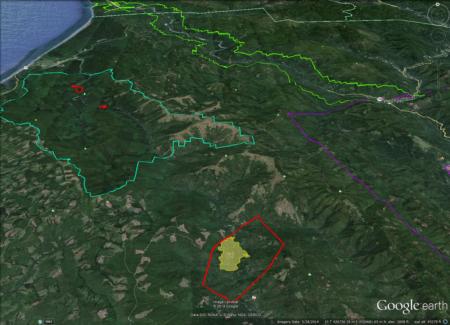
A few locations (small in terms of acreage) off of the extent of these maps were also seen and confirmed to be SOD-caused; these include one location in Redwood National Park and one in the Mad River watershed (see 1st map on this page for locations of corresponding vegetation detections).
Redwood Valley SOD infestation
Discovered in 2010 after baits placed in Redwood Creek at Orick tested positive for the pathogen. In summer/fall of 2014, two new smaller infestations of SOD were found in Redwood National Park, the closest to the Redwood Valley infestation being 11 air miles away. Possible pathways from Redwood Valley to the Redwood National Park include long-distance aerial dispersal of spores or introduction of infested Redwood Creek water to host trees during high water periods or aided by humans/animals.
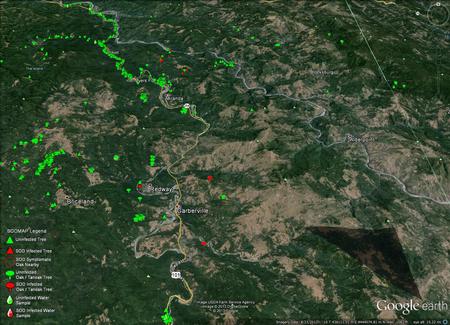
SODMap
Lab-confirmed disease locations in California and Oregon from several contributing groups including Garbelotto Lab (UC Berkeley), Rizzo Lab (UC Davis), Cal Fire, UCCE Humboldt-Del Norte, UCCE Sonoma, UNC Charlotte, Meentemeyer Lab, California Dep. of Food and Agriculture are updated on an interactive map. Click the link or picture below to for the current PC or Mac downloads: http://nature.berkeley.edu/garbelottowp/?page_id=755

